Free online tool
Free online fishbone diagram maker
A fishbone diagram, also called an Ishikawa or cause-and-effect diagram, helps a team find the real causes of a problem. Start from the root cause fishbone template, fill in your own causes, and export it.
No sign-up, no watermark. Export a PNG or PDF.
How a fishbone diagram works
The problem you are investigating sits at the head of the fish. Large bones branch off the spine for the main categories of cause, and smaller bones on each of those hold the specific causes a team has found. Drawing it out stops a group jumping to the first explanation and makes it easy to see which categories have been ignored.
Fishbone diagrams are common in quality improvement, healthcare, manufacturing and IT. They pair well with the five whys: use the fishbone to find the likely categories, then keep asking why inside each one.
What people use it for
- Root cause analysis after an incident or a failure
- Quality improvement and process improvement projects
- Team workshops that need a shared view of what might be going wrong
- Preparing a post-mortem or an audit
- Teaching cause-and-effect thinking
Free templates to start from
Open any template in the editor, then change the text, colours and shapes to fit your own diagram.
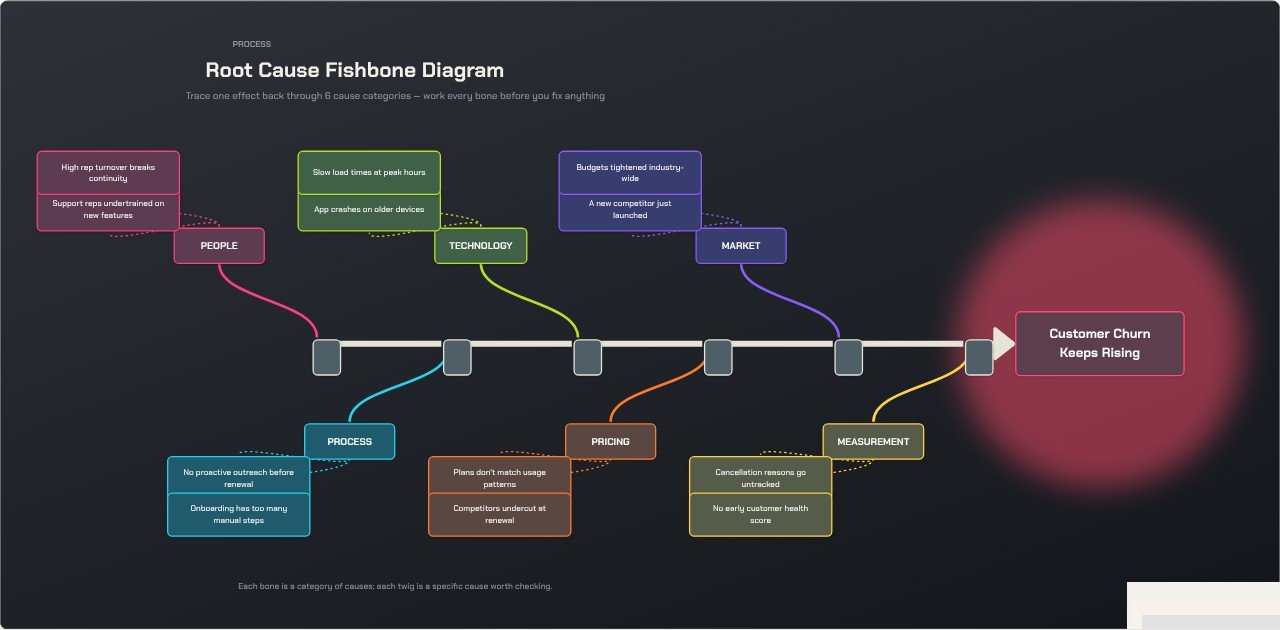 Root Cause Fishbone DiagramProcess template
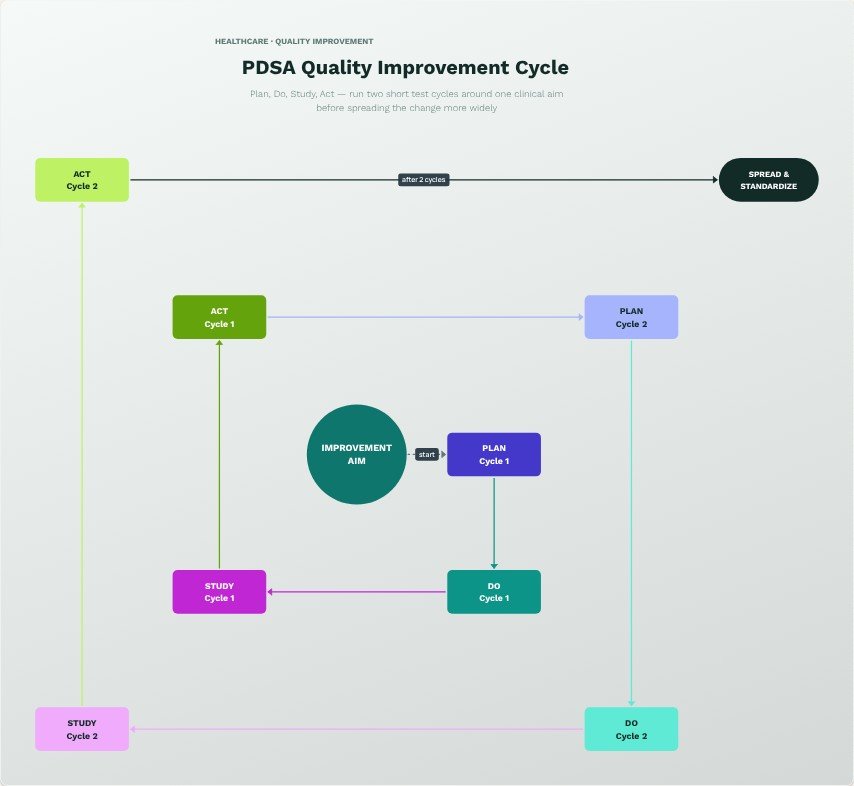 PDSA Quality Improvement CycleHealthcare template
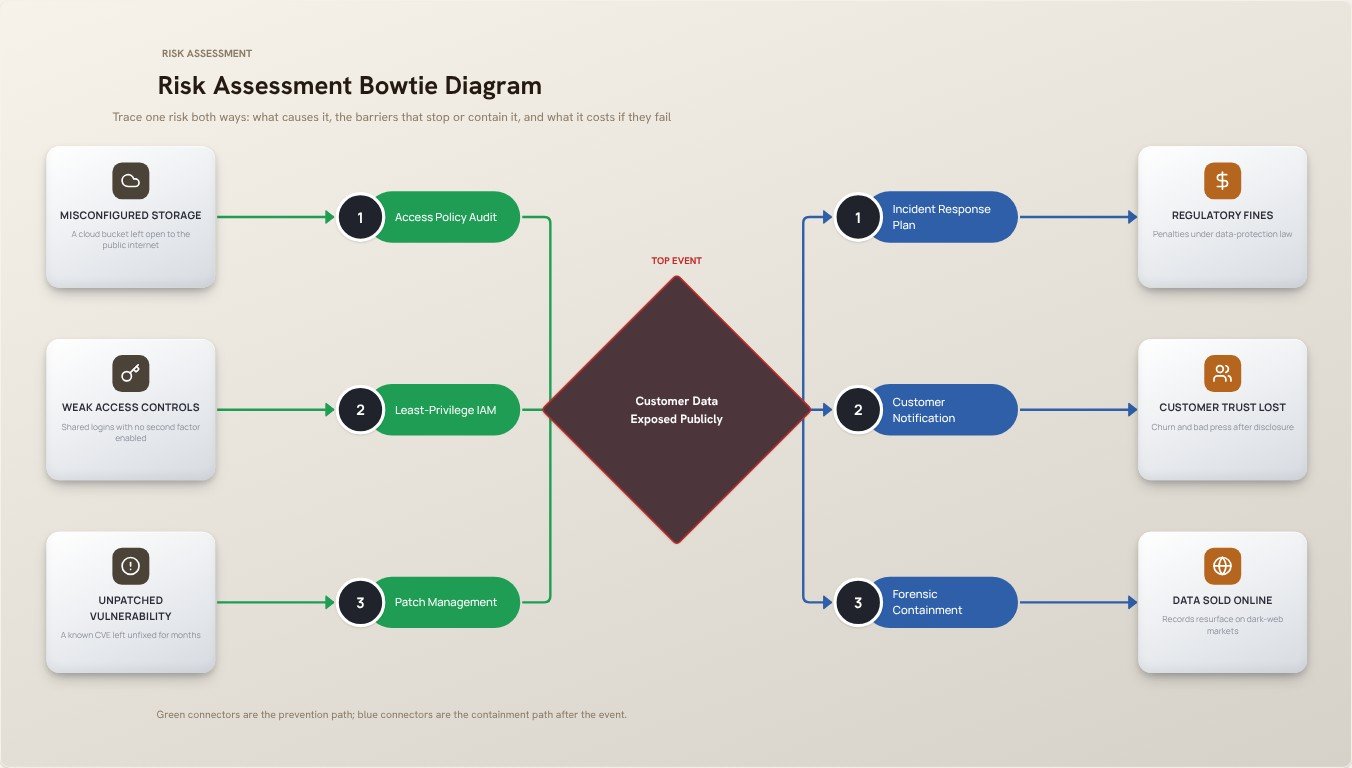 Risk Assessment Bowtie DiagramProject Management template
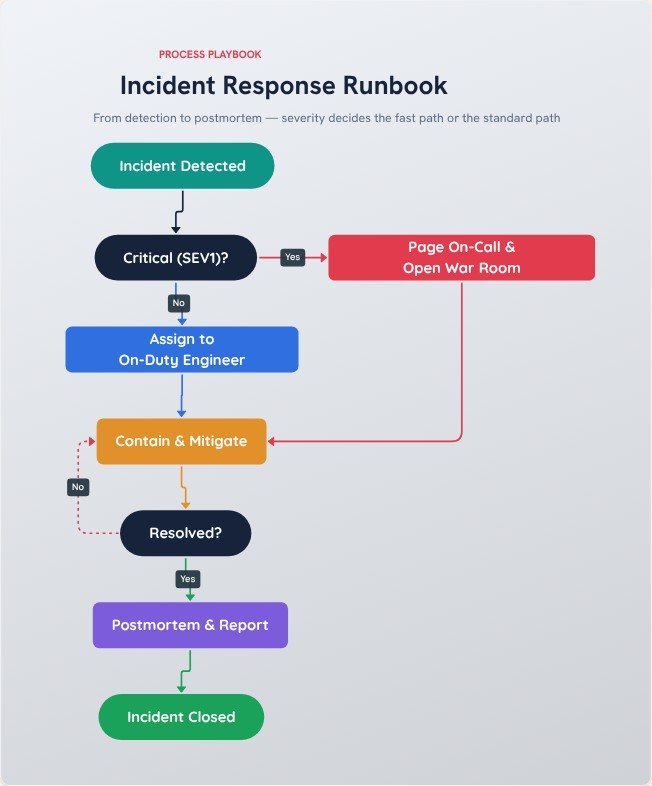 Incident Response RunbookProcess template
How to make one in four steps
- Write the problem as a clear, specific statement at the head of the fish.
- Choose the main categories for the large bones, for example people, process, tools, materials, environment and measurement.
- Brainstorm causes with the team and add each one as a smaller bone on the right category.
- Mark the most likely causes, decide what to test first, then export the diagram.
Tips for a clearer result
- State the problem with a measurable effect, such as "Orders ship late 20% of the time".
- Gather causes first and judge them later. Early criticism stops people sharing ideas.
- A fishbone shows possible causes. Confirm the real one with data before acting.
Frequently asked questions
What is a fishbone diagram used for?
It is used to explore the possible causes of one problem in an organised way, so a team can see all the categories of cause at once instead of fixing the first thing someone suggests.
Is a fishbone diagram the same as an Ishikawa diagram?
Yes. Kaoru Ishikawa popularised the method, so it is also called an Ishikawa diagram or a cause-and-effect diagram. The name fishbone comes from its shape.
Do I need to sign up?
No. Open the editor and start. There is no account, and your diagram is built in your browser, so nothing is uploaded unless you use the AI text-to-flowchart tool.
Can I export it without a watermark?
Yes. Export a high-resolution PNG or a PDF with no watermark. You can pick the quality, choose a square, widescreen or vertical canvas, and export with a transparent background if you want to place the diagram on a slide.